Spec Sheets Miss Real Life
Two sports cars can list the same 0–60 mph time and still drive differently after 20 minutes of hard use. A spec sheet rarely captures how the tires heat up, how brakes fade, or how the car behaves when traction control intervenes. Vehicle type matters because sports cars trade comfort and durability for steering response, tire grip, and brake capacity.
Fuel economy numbers also mislead. EPA estimates for sports cars often land around 20–30 mpg combined, but real highway use can swing by 10–15 mpg depending on speed and tire choice. Insurance and maintenance costs can diverge even when horsepower is close.
Skip the brochure math. It hides the costs that show up later.
Brake rotors and pads are a good example. Many performance packages use larger rotors and higher-friction pads, which can cut stopping distances but raise replacement frequency. Tire life is another gap: a set of summer performance tires may last 15,000–25,000 miles, while all-season tires can stretch farther.
Reliability data also matters. Consumer reporting and warranty claims vary by model year, and sports cars often carry more expensive wear items. For a fair comparison, you need to test the whole ownership loop, not just acceleration.
Common Comparison Mistakes
People compare peak horsepower and ignore how power arrives. A turbo 2.0-liter can feel stronger at midrange than a naturally aspirated 3.0-liter, even if the spec sheet lists similar peak output. The difference shows up during passing, merging, and exiting corners.
Skip the dyno mindset. It misses what happens on the road.
Another mistake is treating “sport” modes as identical. Throttle mapping, shift timing, and traction control calibration can change dramatically between two cars with the same transmission type. One car may sharpen response but also increase wheelspin, while the other may protect grip more aggressively.
Buyers also underestimate brake heat management. If one car uses a smaller rotor or less ducting, repeated stops can lengthen pedal travel. That matters on mountain descents and city commutes with frequent braking.
Ownership costs get overlooked. A sports car with a 3.0-liter V6 might average 22 mpg combined on paper, yet real-world fuel can land closer to 18–20 mpg if you drive spiritedly. Add higher insurance premiums and more frequent tire replacements, and the monthly cost gap grows fast.
Finally, people ignore cabin practicality. A low roofline affects child-seat fit, rear access, and visibility when you’re backing out of a driveway. Even two coupes with similar dimensions can differ in door opening width and seat travel.
Test Plans That Reveal Differences
Do A Two-Route Drive
Drive the cars back-to-back on two routes: one with steady highway speed and one with repeated stops. This exposes how each car handles heat, brake modulation, and tire grip. In practice, you’ll notice whether the steering weights up after a few hard turns, and whether the brake pedal firms or softens.
Use a phone timer and a simple log. I use a Notes app timestamped at 60–80 mph pulls, then I compare the time to settle after each pull. That small habit catches cars that feel fast once, then fade.
Fuel economy is measurable too. If you can, reset the trip meter at the same starting point and compare mpg after 30–50 miles. EPA combined might be 24 mpg, but your route might show 19 mpg in one car and 21 mpg in the other.
Measure Tire And Brake Wear
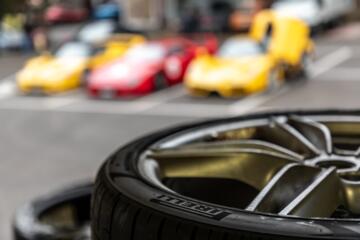
Ask for the tire size and compound type, then estimate wear realistically. Summer performance tires often wear faster than all-seasons, especially with frequent hard acceleration. If one car runs 245/40R19 and the other runs 255/35R20, the wider tire can increase grip but also increase tread wear.
Brake costs depend on pad material and rotor design. Ceramic pads can reduce dust but may cost more and behave differently in cold weather. If you plan spirited driving, look for brake cooling ducts and check whether the car uses pad wear sensors.
Skip the “lifetime brake” claim. It rarely matches how performance cars are driven.
In practice, you can estimate wear by checking how many miles the dealer says the last set lasted, then adjust for your driving. If a previous owner got 20,000 miles on summer tires, expect less with track-style use.
Check Transmission Behavior
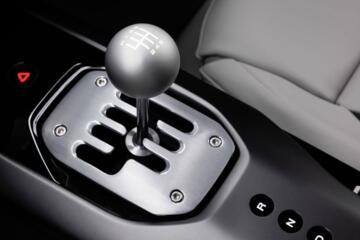
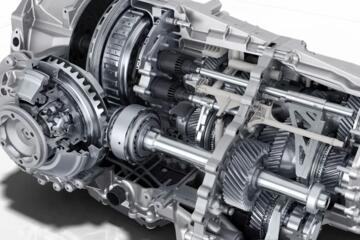
Compare how each transmission manages heat and shift timing. A dual-clutch may deliver quicker shifts, but it can also hold gears longer in sport mode. An automatic with a torque converter may feel smoother but can hunt between ratios on rolling hills.
Test a consistent scenario: accelerate from 30 mph to 60 mph, then coast back to 40 mph. Watch for how often the car downshifts and how quickly it returns to a relaxed state. That pattern affects both drivability and fuel economy.
For numbers, note the time for 30–60 mph and the rpm at the end of the pull. If one car’s 2.0-liter turbo stays at higher rpm longer, it may spend more time in a less efficient zone.
Evaluate Steering And Traction Control
Steering feel is hard to quantify, but you can still compare response. Do a low-speed slalom at 15–25 mph and feel for on-center deadband and how quickly the car changes direction. Then repeat at higher speed on a safe road, watching for stability control intervention.
Traction control behavior matters more than peak grip. One car may allow more wheelspin before cutting torque, which can feel faster but increases tire wear. Another may intervene early, reducing slip but dulling acceleration out of corners.
Use the same tire pressure for both cars during your test. A 3–5 psi difference can change steering response and grip, and it can also skew your seat-of-the-pants comparison.
Inspect Cabin Noise And Visibility
Cabin practicality affects daily use, even in a sports coupe. Measure noise by driving at 60 mph for 10 minutes with windows up and note perceived drone. Some cars with aggressive exhaust tuning create a narrow band of resonance that shows up at specific speeds.
Visibility is another real-world factor. Check blind spots by parking and backing out, then compare mirror placement and rear glass size. If you carry a child seat, confirm rear access and whether the seat base clears the door sill.
For a concrete check, bring a tape measure. Measure the door opening height and the distance from seatback to rear hatch or trunk lip. It’s not glamorous, but it predicts whether you’ll fight the seat every week.
Compare Warranty And Maintenance Costs
Warranty terms can change the risk profile more than horsepower. Look at bumper-to-bumper coverage length, powertrain coverage, and whether wear items like tires and brakes are excluded. Also check service intervals for oil changes and spark plugs if the engine uses them.
Maintenance schedules matter for sports cars. A 3.0-liter V6 with direct injection may require specific oil specs and tighter service intervals than a simpler engine. If the car calls for 0W-20 or 0W-30 with a particular ACEA/ILSAC rating, confirm the local availability and price.
Skip the “free maintenance” fine print. It often excludes performance tires, brake pads, and certain fluids.
Get at least one dealer quote for scheduled service at 10,000 and 20,000 miles. Then compare parts pricing for common wear items like pads and rotors. If one car’s brake job is 30–40% higher, that difference compounds quickly.
Plan For Insurance And Depreciation
Insurance can swing by hundreds per year between two similar sports cars. Request quotes using the same coverage level and driver profile. If one car has higher theft rates or more expensive body panels, premiums often reflect that.
Depreciation trends also affect total cost. Sports cars with high demand for specific trims can hold value better, while cars with unpopular transmission options can drop faster. Check recent auction and trade-in behavior for the exact model year and drivetrain.
Use a simple math check. If Car A costs $2,000 more upfront and sells for $3,000 less after 3 years, the cheaper purchase can still be cheaper overall.
Test Track Readiness If You’ll Drive Hard
If you plan track days, compare brake cooling, tire sizes, and thermal management. A car with a larger brake rotor and dedicated cooling ducts usually handles repeated laps better. You can also look for an oil cooler and transmission cooler, since heat is the enemy of performance.
Ask whether the car supports track mode with stability control settings. Some cars allow partial traction control disable, while others lock it out. That affects lap consistency and tire wear.
For numbers, check recommended brake fluid spec and service intervals. Track use can require fluid changes more often than the normal schedule, and that cost is easy to miss.
Mini Case Studies With Numbers
A small fleet manager compared a 2.0-liter turbo coupe and a 3.0-liter V6 coupe for weekend client drives. The first problem was tire wear: the turbo car ran wider summer tires and needed replacement after about 18,000 miles. The V6 car used slightly narrower all-season performance tires and lasted closer to 28,000 miles.
They also saw brake differences. After repeated mountain routes, the turbo car needed pads at roughly 22,000 miles, while the V6 car stretched to around 30,000 miles. Over 2 years, tire and brake costs came out about $1,600 higher on the turbo car, even though fuel economy was similar on paper.
Result: the fleet switched to the V6 for client comfort and lower wear, not because it was faster on a spec sheet.
In a second case, a buyer tested two cars with similar 0–60 mph times. One car’s dual-clutch held gears longer in sport mode, which improved passing feel but dropped highway mpg by about 3–4 mpg on their 70 mph commute. They also found rear-seat access was tighter on the car with the shorter door opening, which mattered for a child seat swap.
Result: the buyer chose the car that matched their commute and family routine, then they budgeted for tires sooner on that model.
Checklist Beyond Horsepower
| Category | What To Check | How To Test | Why It Matters |
|---|---|---|---|
| Acceleration | 30–60 mph, not just 0–60 | Repeat 3 pulls, log rpm | Shows passing and shift logic |
| Brakes | Rotor size, cooling, pad type | Repeat stops from 60 mph | Reveals fade and pedal feel |
| Tires | Compound and size | Check tread wear history | Predicts replacement timing |
| Noise | Drone at 60–75 mph | 10-minute steady drive | Affects fatigue and commute cost |
| Seats | Door opening and rear access | Dry-fit a child seat | Predicts real family usability |
| Costs | Insurance, service, wear items | Get quotes for 10k/20k service | Shows total 3–5 year spend |
Common Mistakes And Fixes
Buying only the “fastest” trim causes regret when tire and brake costs hit sooner. It happens because performance packages change wheel sizes and tire compounds. The impact shows up as earlier replacements and higher insurance. Avoid it by checking tire size and pad type on the exact trim, then asking for a parts quote.
Skip the “same engine, same car” assumption. It breaks when calibration differs.
Another mistake is ignoring how the car behaves after repeated braking. It happens because test drives are short and roads are smooth. The impact is longer stopping distances and a softer pedal during real descents. Avoid it by doing 3–5 repeated stops from 60 mph and noting pedal feel each time.
People also forget to compare warranty exclusions. It happens because buyers focus on horsepower and monthly payment. The impact is paying out of pocket for sensors, clutches, or cooling components sooner than expected. Avoid it by reading the warranty coverage for powertrain and emissions, then confirming whether the dealer honors it for your driving pattern.
Finally, buyers sometimes ignore child-seat compatibility. It happens because the car looks “two-seat” in photos. The impact is a rear seat that’s unusable or unsafe for installation. Avoid it by checking LATCH/anchor locations and doing a dry-fit with the seat you own.
FAQ
How do I compare two sports cars fairly?
Use the same test conditions. Reset trip meters at the same starting point, then drive a 30–50 mile loop that includes steady highway speed and repeated braking. Log 30–60 mph time and note how the transmission behaves on hills. Check tire size and compound type, then ask about typical tire life for that exact setup. Compare brake feel after repeated stops, not just the first hard stop. Finally, request insurance quotes for the exact trims, since premiums often differ more than horsepower.
What should I test for brake fade?
Brake fade shows up after heat builds, so you need repetition. Do 3–5 stops from about 60 mph with enough spacing to cool slightly, then compare pedal travel and stopping distance each time. Pay attention to whether the pedal firms up or stays long. If one car uses larger rotors, more ducting, or different pad material, it often holds feel better. Also check brake fluid type and service interval in the owner’s manual, since track-style use can require more frequent changes.
Do tire choices change the comparison?
Yes, and they change it quickly. Summer performance tires can deliver stronger grip but often wear faster, especially with frequent hard acceleration and heat. All-season performance tires may last longer but can feel less consistent when temperatures drop or when you push hard. Compare tire sizes and compounds on both cars, then check whether the cars come with staggered setups that complicate rotation. If you drive in wet weather, ask how each tire performs at low tread depths, since wet grip can fall off sooner than dry grip.
How do I estimate real fuel costs?
Start with your route, not the EPA combined number. If your commute is mostly 70 mph, compare mpg after 30–50 miles at that speed range. Then estimate annual fuel cost using your local fuel price and your expected mileage. If one car drops from 24 mpg combined to 19 mpg on your route, the difference can be meaningful over 12,000–15,000 miles per year. Also factor in how sport modes affect throttle mapping and shift timing, since those changes can reduce mpg even when the engine size is similar.
What ownership costs should I ask about?
Ask for quotes on scheduled service at 10,000 and 20,000 miles, plus typical wear items: brake pads/rotors and tire replacement for the factory tire size. Confirm warranty coverage for powertrain and any exclusions for cooling, sensors, and clutch components if the car uses a manual or dual-clutch. Insurance quotes for the exact trim matter too, since sports cars can vary widely in theft risk and repair cost. If you plan spirited driving, ask whether the dealer recommends specific brake fluid or tire pressures for track days.
Author's Insight
Spec sheets measure peak output under controlled conditions, while sports-car ownership is mostly heat management, tire wear, and brake consistency. A 2.0-liter turbo and a 3.0-liter V6 can both hit similar 0–60 mph times, yet one may spend more time in inefficient gearing depending on transmission calibration. Warranty language and wear-item pricing often decide the real cost of ownership more than horsepower does. When I review comparisons, I look for repeatable test steps: the same route, the same reset procedure, and the same questions about tires, pads, and service intervals.
Key Takeaways
Compare two sports cars using repeatable road tests, not just acceleration claims. Log 30–60 mph pulls, repeat braking from 60 mph, and compare fuel economy after 30–50 miles on your route. Then price the wear items that match the factory tire and brake setup, since summer tires and performance pads can change your 3–5 year cost more than the engine choice.
Next steps: request insurance quotes for the exact trims, ask the dealer for service quotes at 10,000 and 20,000 miles, and dry-fit a child seat if rear access matters. If you plan track days, confirm brake cooling features and whether the car supports track-oriented stability control settings. If you notice persistent vibration, pulling, or warning lights during the test drive, stop and have the car inspected before signing anything.